|
|
|
Indian Pediatr 2018;55: 125-130 |
 |
Adiposity and Cortisol Response to Stress in
Indian Adolescents
|
|
GV Krishnaveni 1
, A Jones2, SR
Veena1, R
Somashekara1, SC
Karat1 and CHD
Fall3
1Epidemiology Research Unit, CSI
Holdsworth Memorial Hospital, Mysore, India; 2Department of
Pediatrics, University of Oxford, Oxford, UK; and 3MRC
Lifecourse Epidemiology Unit, University of Southampton, Southampton,
UK.
Correspondence to: Dr Krishnaveni GV, CSI Holdsworth
Memorial Hospital, Mandi Mohalla, Mysore 570021, India.
Email:
[email protected]
Received: July 18, 2016;
Initial review: November 08, 2016;
Accepted: October 04, 2017.
Published online:
December 14, 2017.
PII:S097475591600097
|
|
Objective: We examined associations of different adiposity measures
with cortisol responses during the Trier Social Stress Test for children
(TSST-C).
Design: Descriptive study.
Setting: Holdsworth Memorial
Hospital, Mysore, India.
Participants: Adolescents aged
13.5y from a birth cohort were recruited (N=269, 133 boys).
Methods: The stressor (TSST-C)
was 5-minutes each of public speaking and mental arithmetic tasks in
front of two unfamiliar ‘judges’. Salivary cortisol concentrations were
measured at baseline and at regular intervals after TSST-C. Weight,
height, sub scapular and triceps skinfold thickness, and waist and hip
circumference were measured, and percentage body fat was estimated
(fat%; bioimpedance). Body mass index (BMI) and Waist-to-hip ratio (WHR)
were calculated. All variables were converted into within-cohort SD
scores before analysis. Stress-induced change in cortisol concentrations
from baseline (cortisol response) was examined in relation to adiposity.
Results: Stress increased
cortisol concentrations significantly from baseline (mean (SD): 5.5
(6.4) ng/mL; P<0.001). Higher WHR was associated with lower
cortisol response at 20 and 30-minutes after stress (~0.13 SD decrease
in cortisol response per SD higher WHR, P<0.05). Higher fat% was
also associated with lower cortisol response only in girls 20-minutes
post-stress (0.23 SD lower response per SD higher fat%, P=0.004).
Sum of skinfold thickness and BMI were not associated with cortisol
responses.
Conclusions: Abdominal adiposity
is associated with reduced hypothalamic-pituitary-adrenal axis
reactivity to stress in this adolescent population.
Keywords: Obesity, Trier Social Stress
Test-Children, Stress response, Waist-to-hip ratio.
|
|
P
sychological stress is a well-recognized risk
factor for adult non-communicable diseases (NCD). Chronic stress results
in dysregulated hypothalamic-pituitary-adrenal (HPA) axis activity and
abnormal cortisol release, which trigger the phenotypic aberrations of
stress-related disorders [1]. Increased central/ abdominal adiposity is
one of the proposed consequences of chronic stress. Central adiposity in
turn may alter HPA axis responses [2]. This may then amplify NCD risk in
obese individuals.
Indians have higher truncal and abdominal adiposity
relative to lean body mass and this is thought to contribute to their
increased susceptibility to NCDs [3]. Indians may be particularly
sensitive to the effects of cortisol, especially in the presence of
higher adiposity, which may add to their disease risk [4]. Both
adiposity and stress levels are increasing steadily in Indian children
and adolescents. We aimed to test the hypothesis that higher adiposity
is associated with altered cortisol response to stress in Indian
children. We examined associations of different adiposity measures on
cortisol responses measured during the Trier Social Stress Test for
Children (TSST-C) in adolescents from the Mysore Parthenon Cohort.
Methods
The Parthenon cohort was established at Holdsworth
Memorial Hospital (HMH), Mysore during 1997-1998 to examine early-life
factors associated with adult NCD risk [5]. The original cohort
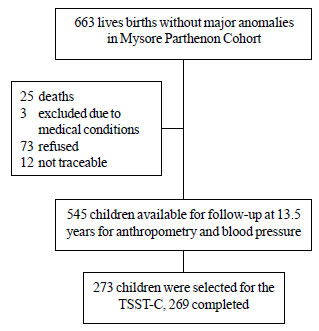
comprised 663 normal singleton babies born to mothers whose
anthropometry and gestational diabetes (GDM) status were assessed at ~30
weeks of gestation (Fig. 1). The babies were followed-up
regularly from birth. At 13.5 years, 545 children were available for
anthropometry, and cardio-metabolic and cognitive assessments. During
2011-2012, in a subsample (N=273), we adapted and administered
the TSST-C, a well-accepted method of standardising the stressor
component in a research setting [6]. The TSST has been shown in European
populations to produce reliable cortisol response in adolescents [7].
All cohort children living in Mysore city (N=354) were eligible
for the study. Equal number of eligible boys and girls representing
different birth weight quartiles were recruited consecutively in the
chronological order of their birth until the target number was reached.
 |
|
Fig. 1 Flow chart of the study
participants.
|
A baseline salivary sample was collected 10 minutes
before the TSST-C, after the children had watched a calming video for 5
minutes. For the TSST-C, each child completed 5-minute each of public
speaking (imaginative story telling) and mental arithmetic tasks (serial
subtraction) in front of two unfamiliar adult ‘evaluators’ as described
before [8]. Post-test salivary samples were collected at 10, 20, 30, 40
and 70 minutes after stress induction.
Weight (Salter, UK), height (Microtoise, CMS
instruments, UK), subscapular and triceps skinfold thickness (Harpenden
callipers, CMS instruments), and waist and hip circumference
(anthropometric tape) were measured. Body mass index (BMI) and
waist-to-hip circumference ratio (WHR) were estimated. Percentage body
fat (fat%) was measured using the Bioimpedance method (Bodystat,
Quadscan 4000, UK). Resting systolic and diastolic blood pressures (BP)
were measured using an automated BP monitor (Dinamap 8100, Criticon,
USA). Pubertal development was assessed as the stage of breast
development (girls) or genital development (boys) using Tanner’s method
[9]. Socio-economic status (SES) was determined using the Standard of
Living Index designed by the National Family Health Survey-2 [10].
Fasting blood samples were collected the following day.
Laboratory assays were carried out at the Diabetes
Unit, KEM Hospital Research centre, Pune. Salivary cortisol
concentrations were measured using an ELISA method (Alpco Diagnostics,
USA). The assay sensitivity was 1 ng/mL; inter- and intra-assay
coefficients of variation were 10.0% and 6.6%, respectively. Plasma
glucose, insulin and lipid concentrations were measured, as described
elsewhere [11]. Insulin resistance was estimated using the Homeostasis
Model Assessment (HOMA-IR) equation [12].
The ethics committee of Holdsworth Memorial Hospital
approved the study; informed written consent from parents and assent
from children were obtained.
Statistical methods: Cortisol and insulin
concentrations and HOMA-IR were log-transformed to satisfy the
assumption of normality. Partial correlations were used to examine
associations between adiposity measures and cardio-metabolic outcomes.
Associations of BMI, fat%, and sum of subscapular and triceps skin fold
thickness (subcutaneous adiposity) and WHR (central/abdominal adiposity)
with repeated cortisol measures were examined using linear mixed-model
analyses to account for within group correlations. Cortisol
concentrations at all time points were included in the models to examine
the change in cortisol from baseline over time (stress response).
Exposure and outcome variables were converted into within-cohort SD
scores (SDS) before analysis. The data represent SD change in cortisol
response per SD change in adiposity. All analyses were adjusted for age,
sex, pubertal stage, SES, birth weight, gestational age at birth and
maternal BMI and GDM status. These were chosen as a priori
covariates likely to be associated with children’s adiposity or outcome
measurements. Analyses were done using SPSS v 21.0 and STATA v 12.
Results
The TSST-C was completed by 269 children. Girls had
greater BMI, fat% and skinfold thickness and higher HOMA-IR; boys had
higher WHR, fasting glucose and resting systolic and diastolic BP (Table
I). There were no differences in baseline or post-stress cortisol
concentrations between boys and girls.
TABLE I General Characteristics of the Study Population (N=269)
|
Boys (N=133) |
Girls (N=136) |
|
Age (yr) |
13. 6 (0.2) |
13.6 (0.1) |
|
Birth weight (g) |
2890 (490) |
2883 (456) |
|
Height (cm) |
154.7 (8.2) |
153. 7 (5.7) |
|
*Body mass index (kg/m2) |
17.0 (2.3) |
18.6 (3.1) |
|
*Body fat (%), n=268 |
17.4 (6.7) |
26.6 (5.7) |
|
*Sum of skinfolds (mm) |
23.1 (11.7) |
32.3 (10.7) |
|
*Waist-to-hip ratio |
0.90 (0.05) |
0.87 (0.05) |
|
Socioeconomic status (score) |
38.4 (6.7) |
37.8 (6.6) |
|
*Fasting glucose (mmol/L), n=265 |
5.2 (0.5) |
5.0 (0.4) |
|
*Fasting Insulin (pmol/L)#, n=265 |
36.7 (26.2,48.9) |
49.4 (39.4,64.7) |
|
*Insulin resistance (HOMA-IR)*, n=265 |
1.4 (1.0,1.8) |
1.8 (1.5,2.4) |
|
*Systolic blood pressure (mmHg) |
111.3 (8.7) |
107.7 (7.2) |
|
*Diastolic blood pressure (mmHg) |
63.1 (6.7) |
59.3 (6.5) |
|
Total cholesterol (mmol/l), n=268 |
3.6 (0.7) |
3.7 (0.6) |
|
Triglycerides (mmol/l), n=268 |
0.83 (0.43) |
0.89 (0.36) |
|
HDL cholesterol (mmol/l), n=268 |
1.10 (0.24) |
1.07 (0.23) |
|
Baseline cortisol (ng/mL)#, n=266 |
6.7 (4.6,8.9) |
6.6 (5.2,9.1) |
|
Mean post-stress cortisol (ng/mL)* |
11.5 (7.9,18.2) |
10.7 (7.6,16.3) |
|
HOMA-IR: Homeostasis Model Assessment for Insulin
Resistance; All values in mean (SD) or #median
(IQR);*P<0.001; $P=0.009; n=269, unless stated
otherwise. |
Generally, higher adiposity was associated with
higher fasting insulin, triglyceride and total cholesterol
concentrations, HOMA-IR and systolic BP, and lower HDL-cholesterol
concentrations (P<0.05). Higher fat% was associated with lower
baseline cortisol concentrations (-0.22 SD per SD increase in fat%, 95%
CI: -0.39, -0.06 SD; P=0.008). There were no associations between
other adiposity measures and baseline cortisol.
 |
|
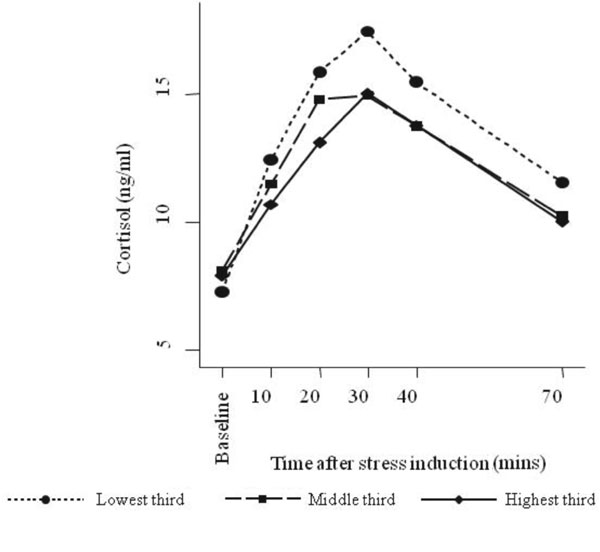
Fig.2 Change in salivary cortisol
concentration from baseline after stress-induction according to
children’s waist-to-hip ratio (using sex-specific thirds).
|
Overall, cortisol concentrations increased from
baseline after inducing stress (mean (SD) increase: 5.5 (6.4) ng/mL,
P<0.001) (Web Fig. 1). Adolescents with higher WHR had
lower cortisol responses at all time points after stress induction,
strongest at 20 and 30 minutes post-stress (Table II, Fig.
2). Associations appeared somewhat stronger in girls (Web
Table I) but sex-specific differences in these associations were
not supported by formal interaction testing. Higher fat% was associated
with lower cortisol response to stress only in girls, especially 20
minutes after inducing stress (P for interaction by sex=0.02) (Web
Table I). BMI and sum of skinfold thickness were not associated
with cortisol responses.
Table II Cortisol Responses to Stress According to Different Adiposity Measures
|
|
Salivary cortisol
concentrations (SDS)* |
|
10 min |
20 min |
30 min |
40 min |
70 min |
|
Waist-hip ratio (SDS) |
|
Model 1: b (95% CI) |
-0.08(-0.18,0.03) |
-0.12(-0.22,-0.01) |
-0.11(-0.21,-0.01) |
-0.09 (-0.20,0.01) |
-0.09 (-0.19,0.02) |
|
P value |
0.2 |
0.03 |
0.04 |
0.08 |
0.1 |
|
Model 2: b (95% CI) |
-0.09(-0.19,0.02) |
-0.13(-0.24,-0.02) |
-0.13(-0.25,-0.02) |
-0.10(-0.21,0.00) |
-0.09(-0.21,0.02) |
|
P value |
0.1 |
0.02 |
0.02 |
0.07 |
0.09 |
|
Body fat% (SDS) |
|
Model 1: b (95% CI) |
-0.04(-0.13,0.06) |
-0.03(-0.12,0.07) |
-0.00(-0.10,0.10) |
-0.00(-0.10,0.09) |
-0.03(-0.13,0.06) |
|
P value |
0.5 |
0.6 |
1.0 |
1.0 |
0.5 |
|
Model 2: b (95% CI) |
-0.05(-0.15,0.06) |
-0.04(-0.14,0.06) |
-0.01(-0.10,0.10) |
-0.01(-0.11,0.09) |
-0.03(-0.13,0.07) |
|
P value |
0.4 |
0.5 |
0.9 |
0.9 |
0.6 |
|
Sum of skinfolds (SDS) |
|
Model 1: b (95% CI) |
-0.00(-0.10,0.10) |
-0.05(-0.15,0.05) |
-0.05(-0.15,0.05) |
-0.03(-0.13,0.07) |
-0.04(-0.14,0.06) |
|
P value |
1.0 |
0.3 |
0.3 |
0.6 |
0.4 |
|
Model 2: b (95% CI) |
-0.02(-0.13,0.08) |
-0.06(-0.16,0.05) |
-0.05(-0.16,0.05) |
-0.04(-0.15,0.06) |
-0.06(-0.16,0.05) |
|
P value |
0.7 |
0.3 |
0.3 |
0.4 |
0.3 |
|
Body Mass Index (SDS) |
|
Model 1: b (95% CI) |
-0.02(-0.12,0.09) |
-0.05(-0.16,0.06) |
-0.05(-0.16,0.05) |
-0.03(-0.13,0.08) |
-0.04(-0.15,0.06) |
|
P value |
0.8 |
0.4 |
0.3 |
0.6 |
0.4 |
|
Model 2: b (95% CI) |
-0.04(-0.15,0.07) |
-0.05(-0.16,0.06) |
-0.05(-0.16,0.07) |
-0.03(-0.14,0.08) |
-0.05(-0.16,0.06) |
|
P value |
0.5 |
0.4 |
0.4 |
0.6 |
0.4 |
|
SDS: Standard Deviation Score; b: represents SDS change in
cortisol response per SDS change in fat%; *Logged variable;
Model 1: adjusted for children’s age and sex; Model 2 adjusted
for children’s age, sex, pubertal stage, birth weight,
gestational age, socioeconomic status, and maternal BMI and
gestational diabetes status |
Discussion
In this group of healthy adolescents, greater
abdominal adiposity and total fat% were associated with diminished
cortisol responses to acute stress. There was no association of either
subcutaneous adiposity or BMI with cortisol responses.
Higher abdominal/visceral adiposity is a major risk
factor for adult NCDs [13]. Release of excess free fatty acids into the
circulation is one of the suggested mechanisms. Greater adiposity is
also thought to increase cortisol response to stress [2], thus adding to
disease risk. Indeed, studies in adults have shown an association
between higher abdominal adiposity and greater cortisol reactivity [14].
In contrast, our study observed a reduced cortisol response to stress.
Previous studies have consistently shown inverse associations between
body weight and adiposity, and circulating cortisol concentrations in
the non-stressed state, possibly resulting from increased peripheral
metabolism of cortisol [15]. A few studies have also observed similar
inverse associations during stress. In the Dutch Famine Birth cohort
adults, there was a 20% decrease in cortisol response to stress in
relation to skinfold thickness [16]. In UK, higher visceral adiposity
was associated with a blunted cortisol response to stress tasks [17].
Even in children, salivary cortisol response to behavioral stress tasks
was inversely associated with higher BMI (0.17 SD per SD decrease in
cortisol) in one study [18].
Mechanisms underlying a diminished cortisol response
during stress in relation to adiposity are speculative. Researchers
suggest that repeated stress exposure, which is a risk factor for higher
adiposity, eventually ‘burns out’ the HPA axis, leading to a blunted
cortisol response [2]. However, such an extreme manifestation of chronic
stress is unlikely in these young participants. On the other hand,
reduced stress responses may be related to their behavior and
perception. Motivation to perform well and a greater effort to engage in
the stress-inducing tasks are important triggers for cortisol release
during TSST-C [7]. Adolescents with lower motivation may have a blunted
stress response. Lower awareness may result in lower perceived stress,
and thus reduced cortisol response. Higher adiposity has been shown to
be associated with lower cognitive ability in children [19], though it
was associated with better cognitive performance in our participants
during childhood [20].
A chronically elevated HPA axis response and higher
circulating cortisol are associated with cardiometabolic and
psychological abnormalities that increase NCD risk [1,21]. In this
context, lower cortisol response in our adipose adolescents appears to
be protective. Some researchers argue that physiologically decreased
cortisol may be an adaptive mechanism to minimise its harmful effects in
potentially pathological conditions [22]. In particular, higher cortisol
release may amplify the cardiometabolic risks associated with higher
adiposity. However, a few studies have shown associations between
blunted cortisol response and a variety of adverse psychological health
outcomes such as depression and substance abuse behaviours [23]. An
optimum HPA axis activity prepares body’s physiological systems to cope
with stressful situations. Researchers suggest that a hypo-reactive HPA
axis represents a ‘less-adaptive’ neuro-endocrine system, which fails to
perform optimally during a challenge [23]. Hence, a reduced reactivity
may indicate a reduced ability to deal with daily stresses in adipose
adolescents.
We used salivary method for cortisol assessment as it
is non-invasive and enabled multiple sampling required for this study,
and is a reliable marker of the level of circulating free cortisol
concentrations [24]. Stress responses were measured only in urban
children which reduces the generalizability of our findings.
Adolescents’ background stresses that may have influenced their stress
response were not measured. Measurement of abdominal adiposity was based
on anthropometry; however, our findings correspond to those observed
using magnetic resonance imaging [17]. Several biological and
environmental factors including age, sex and timing of the test may
induce variability in salivary cortisol. However, a comprehensive range
of measurements during pregnancy, at birth and current follow-up and
standardised stress test conditions enabled relevant adjustments.
In conclusion, our findings, in the light of existing
evidence, indicate that increased abdominal adiposity reduces stress
reactivity which may compromise their ability to maintain homeostasis
during challenging situations. This combined with cardio metabolic risks
associated with visceral adiposity may increase future NCD consequences
in these adolescents. Our study was not designed to examine the causal
associations between adiposity and stress responses, hence we cannot
rule out the effect of residual confounding on these findings. Our
continued follow-up of this cohort may provide clues to the role of
optimised stress responses in reducing NCD risks in vulnerable children.
Acknowledgements: We thank Sneha-India for its
support.
Contributors: GVK, AJ, CHDF: conceived and
designed the study; GVK, SRV, RS, SCK acquired the data; GVK, AJ, CHDF:
analyzed and interpreted data; GVK, CHDF drafted the article. All
authors revised the manuscript critically for important intellectual
content, and approved the final version.
Funding: Parthenon Trust, Switzerland; Welcome
Trust, UK; and Medical Research Council, UK.
Competing interests: None stated.
| |
|
What is Already Known?
• Indian children and adults have higher
central adiposity relative to lean mass, which increases their
chronic disease risk.
What This Study Adds?
• Higher central adiposity is associated with altered
hypothalamic-pituitary-adrenal axis (cortisol) response to
stress in Indian adolescents.
|
References
1. McEwen BS. Protective and damaging effects of
stress mediators. N Engl J Med. 1998;338:171-9.
2. Bjorntorp P, Rosmond R. Obesity and cortisol.
Nutrition. 2000;16:924-36.
3. Yajnik, C.S. Early life origins of insulin
resistance and type 2 diabetes in India and other Asian countries. J
Nutr. 2004;134:205-10.
4. Ward AM, Fall CH, Stein CE, Kumaran K, Veena SR,
Wood PJ, et al. Cortisol and the metabolic syndrome in south
Asians. Clin Endocrinol. 2003;58:500-5.
5. Krishnaveni GV, Veena SR, Hill JC, Karat SC, Fall
CH. Cohort Profile: Mysore Parthenon Birth Cohort. Int J Epidemiol.
2015;44:28-36.
6. Jones A, Godfrey KM, Wood P, Osmond C, Goulden P,
Philips DI. Fetal growth and the adrenocortical response to
psychological stress. J Clin Endocrinol Metab. 2006; 9:1868-71.
7. Gunnar MR, Talge NM, Herrera A. Stressor paradigms
in developmental studies: What does and does not work to produce mean
increases in salivary cortisol. Psychoneuro- endocrinology.
2009;34:953-67.
8. Krishnaveni GV, Veena SR, Jones A, Bhat DS,
Malathi MP, Hellhammer D, et al. Trier Social Stress Test in
Indian adolescents. Indian Pediatr. 2014;51:463-7.
9. Tanner JM. Growth in Adolescence. 2nd edition,
Blackwell Scientific Publications; Oxford, England, 1962.
10. International Institute for Population Sciences
(IIPS) and Operations Research Centre (ORC) Macro 2001. National Family
Health Survey (NFHS-2), India 1998-1999. IIPS: Maharashtra, Mumbai.
11. Krishnaveni GV, Veena SR, Karat SC, Yajnik CS,
Fall CH. Association between maternal folate concentrations during
pregnancy and insulin resistance in Indian children. Diabetologia.
2014;57:110-21.
12. Matthews DR, Hosker JP, Rudenski AS, Naylor BA,
Treacher DF, Turner RC. Homeostasis model assessment: insulin resistance
and-cell function from fasting glucose and insulin concentrations in
man. Diabetologia. 1985;28:412-9.
13. Bjorntorp P. Visceral obesity: a "civilization
syndrome." Obes Res. 1993;1:206-22.
14. Incollingo Rodriguez AC, Epel ES, Whitea ML,
Standen EC, Seckl JR, Tomiyama AJ. Hypothalamic-pituitary-adrenal axis
dysregulation and cortisol activity in obesity: A systematic review.
Psychoneuroendocrinology. 2015;62: 301-18.
15. Morton NM. Obesity and corticosteroids: 11 b-hydroxysteroid
type 1 as a cause and therapeutic target in metabolic disease. Mol Cell
Endocrinol. 2010;316:154-64.
16. De Rooij SR. Blunted cardiovascular and cortisol
reactivity to acute psychological stress: A summary of results from the
Dutch famine birth cohort study. Int J Psychophysiol. 2013;90:21-7.
17. Jones A, McMillan MR, Jones RW, Kowalik GT,
Steeden JA, Deanfield JE et al. Adiposity is associated with
blunted cardiovascular, neuroendocrine and cognitive responses to acute
mental stress. Plos One. 2012;7: e39143.
18. Miller AM, Clifford C, Sturza J, Rosenblum K,
Vazquez DM, Kaciroti N, et al. Blunted cortisol response to
stress is associated with higher body mass index in low-income
preschool-aged children. Psychoneuroendocrinology. 2013; 38:2611-7.
19. Kamijo K, Khan NA, Pontifex MB, Scudder MR, Drollette
ES, Raine LB, et al. The relation of adiposity to cognitive
control and scholastic achievement in pre-adolescent children. Obesity.
2012;20:2406-11.
20. Veena SR, Hegde BG, Ramachandraiah S, Krishnaveni
GV, Fall CH, Srinivasan K. Relationship between adiposity and cognitive
performance in 9-10-year-old children in South India. Arch Dis Child.
2014;99:126-34.
21. Girod JP, Brotman DJ. Does altered glucocorticoid
homeostasis increase cardiovascular risk? Cardiovascular Research.
2004;64:217-26
22. Fries E, Hesse J, Hellhammer J, Hellhammer DH. A
new view on hypocortisolism. Psychoneuroendocrinology. 2005;30:1010-16.
23. Allen MT. Integrative commentary: Implications of
blunted reactivity. Int J Psychophysiol. 2013;90:95-8.
24. Jessop DS, Turner-Cobb JM. Measurement and
meaning of salivary cortisol: A focus on health and disease in children.
Stress. 2008;11:1-14.
|
|
|
 |
|
