|
|
|
Indian Pediatr 2011;48: 105-110 |
 |
Measuring Obesity among School-aged Youth in
India: A Comparison of Three Growth References |
|
MH Stigler, M Arora*, P Dhavan, V Tripathy*, R Shrivastav*, KS Reddy* and
CL Perry
From Michael & Susan Dell Center for Advancement of
Healthy Living, School of Public Health, University of Texas,
Austin and Houston, Texas, USA; and *HRIDAY (Health-Related Information
Dissemination Amongst Youth), Delhi, India.
Correspondence to: Melissa H Stigler, Assistant
Professor, Michael & Susan Dell Center for Healthy Living,
Austin Regional Campus, School of Public Health, UT Health, University of
Texas Administration Building (UTA) 1616 Guadalupe Street, Suit 6.300,
Austin, TX 78701, USA.
Email: [email protected]
Received: November 11, 2009;
Initial review: December 10, 2009;
Accepted: March 02, 2010.
Published online: 2010 August 1.
PII: S097475590900802-1
|
|
Abstract
Objective: To compare three growth references
that can be used to assess the weight status of school-aged youth living
in India, with a particular focus on identifying overweight and obese
youth.
Study Design: Cross-sectional study. Kappa
scores were used to measure agreement between growth references.
Regression models were used to test for differences in weight status by
grade level, gender, and school type, using each growth reference.
Setting: Private (n=4) and Government
schools (n=4) in Delhi, India.
Participants: Students (n=1818)
in eighth and tenth grade attending the schools.
Main outcome measures: Weight status
was derived using age- and gender-specific cut-points provided by: (a)
a national growth reference specific to India; (b) an
international reference recommended by the International Obesity Task
Force (IOTF); and (c) a new international reference recommended
by the World Health Organization (WHO).
Results: The IOTF reference
consistently classified participants in a lower weight status category,
compared with the national reference (k=0.57)
and the WHO reference (k=0.69). The
agreement between the WHO and the national references was higher (k=0.84).
Conclusions: To date, all published
studies of childhood obesity in India have used the IOTF reference, the
national reference, or an old WHO reference to measure weight status
among school-going youth. The new WHO reference may be a better choice.
Compared to the IOTF reference, it does not appear to underestimate
obesity and can still be used to compare trends, globally.
Key words: Adolescents, Growth reference, India, Measurement,
Obesity.
|
|
Obesity among school-aged youth is a
growing public health problem in India [1]. This crisis appears to be
rising rapidly, especially in cities and among affluent youth [2-4].
Compared to countries in the West, many negative sequelae of obesity, like
diabetes, occur at earlier ages [4,5] and at lower BMI cut-points [6] in
India, which makes obesity a particularly serious public health issue in
this country.
It is critical to be able to accurately identify
obesity among school-going youth, for clinical and epidemiologic purposes.
Many growth references can be used [7-10]. Each uses age- and
gender-specific body mass index (BMI) cut-points to classify young people
according to their weight status (eg, overweight or obese). To date, all
studies of obesity among school-going youth in India have employed either
(a) a National reference [7]; (b) the older National Center
for Health Statistics/ World Health Organization (NCHS/WHO) reference [8];
and/or (c) the International Obesity Task Force (IOTF) reference
[9]. None have used the growth reference recently released by the WHO for
school-aged children [5 to 19 years old) [10]. This growth reference was
developed after the release of a new reference for preschool children (0
to 5 years old) in 2006 [11]. Data from a multi-national sample of
preschool children, including children from India, were merged with the
1977 NCHS data (1-21 years old) to construct new growth curves for
school-aged youth. This "new" WHO reference replaces the "old" WHO/NCHS
reference.
The purpose of this paper is to compare this WHO
reference [10] with the national [7] and IOTF [8] references to assess the
extent to which they agree in regards to classifying weight status, with a
special focus on identifying overweight or obese youth.
Methods
This cross-sectional study was conducted in 2006, when
eight schools in New Delhi, India were recruited to participate in the
study. Four were Private schools (middle-upper SES) and four were
Government schools (low SES). Ethical clearances for the study were
obtained from the appropriate boards in India and the US. Passive parental
consent and active student assent were required to participate. The study
included (a) anthropometric measures; (b) a survey of
nutrition and physical activity behaviors; and (c) a survey specific to
‘westerni-zation’ or cultural adaptation within this setting.
All students enrolled in the 8th and 10th grades in
these eight schools were eligible and asked to participate (n=2339).
Response rates for the anthropometric measures, the survey of the
behaviors, and the "westernization" survey were 87.2%, 88.6%, and 92.0%,
respectively. Non-participants included parent refusals (<1%), student
refusals (<1%), and absentees (7-11%). The analysis sample includes 1818
students who participated in all three data collection efforts. Of these,
60% were boys, 52% attended a Private school, and 55% were in 8 th
grade. The mean age of 8th and 10th graders was 13.9 and 15.8 years,
respectively.
Anthropometric data (i.e., height, weight) were
collected from these students using standardized protocols adapted from
Lohman and colleagues [13] to meet needs specific to this context. Weight
was measured using a digital scale that was transported to each school.
The scale was calibrated daily, and each student’s weight was recorded to
the nearest 0.1 kg. Height was measured using a calibrated vertical bar
and was recorded to the nearest 0.5 cm. Data were collected by two-person
teams of trained research staff.
Body mass index (BMI) was used to classify the
participants according to their weight status (i.e., underweight, normal
weight, overweight, or obese) using age- and gender-specific cut-points
recommended by three growth references: (a) the International
Obesity Task Force (IOTF) [9]; (b) the WHO recommendations [10];
and (c) a National (i.e., Indian) study [7]. The classification of
participants across these growth references was compared. Kappa statistics
were calculated to measure agreement between each pair of growth
references [14,15]. Kappa at 1.00 implies perfect agreement. Mixed-effects
regression models were used to test for differences in the percentage of
participants who could be classified as overweight or obese by grade
level, gender, and school type. School was specified as a nested random
effect in the regression models [16].
Results
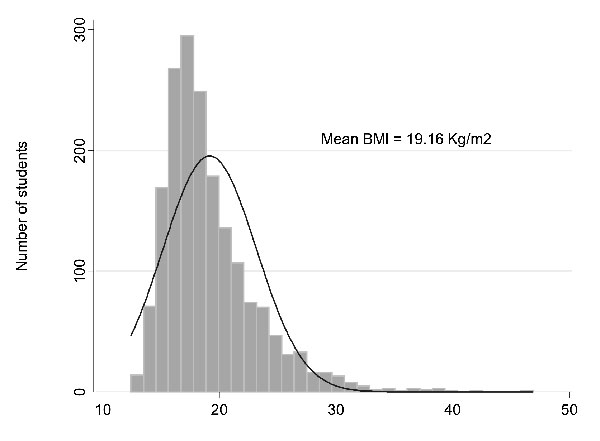
The mean and median BMI in this sample of school-going
youth were 19.16 and 18.14 kg/m 2,
respectively. The distribution of BMI was skewed to the right, with a long
tail at higher BMI values (Fig. 1). Tenth graders had a
higher BMI than eighth graders (19.64 vs 18.54, P<0.001),
girls had a higher BMI than boys (19.42 vs 18.77, P<0.001),
and Private school students had a higher BMI than students in Government
schools (20.44 vs 17.63, P<0.001).
 |
|
Fig. 1 Distribution of BMI among study
subjects (n=1818). |
The distribution of participants by weight status and
growth reference is presented in Table I. The agreement
between the IOTF and WHO references ( k=0.69)
and the IOTF and Indian references (k=0.57)
was similar and lower than the agreement between the WHO and Indian
references (k=0.84).
The IOTF reference classified participants in lower weight status
categories, across all categories, compared to both the WHO and Indian
growth references. Similar trends were observed when comparing the IOTF
and Indian growth references. The Indian and WHO growth references were,
in contrast, reasonably similar. The agreement between all references
improved when weight status categories were collapsed to reflect
obese/overweight students vs normal weight/underweight students (IOTF
vs WHO, k
= 0.89; IOTF vs India,
k
= 0.94; WHO vs India,
k = 0.92).
TABLE I


Distribution of Participants by Weight Status and Growth Reference (N=1818)
|
IOTF reference* |
| |
Obese |
Overweight |
Normal weight |
Underweight |
Total |
|
| |
n (%) |
n (%) |
n (%) |
n (%) |
|
Kappa (95% CI) |
|
WHO reference# |
|
Obese |
59 (65.6%) |
31 (34.4%) |
0 |
0 |
90 |
|
|
Overweight |
0 |
158 (75.2%) |
52 (24.8%) |
0 |
210 |
|
|
Normal weight |
0 |
0 |
910 (73.6%) |
327 (26.4%) |
1237 |
|
|
Underweight |
0 |
0 |
0 |
281 (100%) |
281 |
|
|
Total |
59 |
189 |
962 |
608 |
1818 |
|
| |
|
|
|
|
|
0.69 (0.66, 0.72)** |
| |
|
|
|
|
|
0.89 (0.86, 0.92)## |
|
Indian reference‡ |
|
Obese |
59# (64.8%) |
32* (35.2%) |
0* |
0* |
91 |
|
|
Overweight |
0 |
157 (67.1%) |
77 (32.9%) |
0 |
234 |
|
|
Normal weight |
0 |
0 |
885 (66.9%) |
437 (33.1%) |
1322 |
|
|
Underweight |
0 |
0 |
0 |
171 (100%) |
171 |
|
Total |
59 |
189 |
962 |
608 |
1818 |
|
| |
|
|
|
|
|
0.57 (0.55,0.61)** |
| |
|
|
WHO reference# |
|
|
0.84 (0.81,0.88)## |
|
Indian reference‡ |
|
|
|
|
|
|
|
Obese |
85 (93.4%) |
6 (6.6%) |
0 |
0 |
91 |
|
|
Overweight |
5 (2.1%) |
197 (84.2%) |
32 (13.7%) |
0 |
234 |
|
|
Normal weight |
0 |
7 (0.5%) |
1203 (91.0%) |
112 (8.5%) |
1322 |
|
|
Underweight |
0 |
0 |
2 (1.2%) |
169 (98.8%) |
171 |
|
Total |
90 |
210 |
1237 |
281 |
1818 |
|
| |
|
|
|
|
0.85 (0.83,0.87)** |
|
| |
|
|
|
|
0.92 (0.90,0.95)** |
|
|
* Using age- and gender-specific
cut-points from the International Obesity Task Force (9); # Using age-
and gender-specific cut-points from the World Health Organization(10);
‡Using age- and gender-specific cut-points from an Indian growth
reference study (7); d Considers four weight status categories,
separately (i.e., obese vs. overweight vs. normal weight vs.
underweight); **Kappa statistic, considering four weight status
categories, separately; ##Kappa statistic, considering two groups of
weight status categories, combined. |
Using the IOTF, the WHO, and the Indian growth
references, the prevalence of obesity was estimated at 3.25%, 4.95%, and
5.01%, respectively, while the prevalence of overweight was estimated to
be 10.40%, 11.55%, and 12.87%, respectively. These estimates were combined
to examine whether the prevalence of obesity/overweight varied by grade,
gender, or school type (Table II). There were no differences
by grade level. The prevalence of overweight/obesity was slightly higher
among boys compared to girls, but this difference was only statistically
significant when using the Indian reference (13.86% vs 9.80%, P=0.007).
The prevalence of overweight/obesity, by comparison, was much higher among
students enrolled in private schools compared to those in Government
schools. The difference was statistically significant in each of the three
growth references (WHO: 26.62% vs 3.98%, P<0.001; IOTF:
21.99% vs 3.13%, P<0.001; Indian: 28.61% vs 4.48%,
P<0.001). The percentage of students who were either overweight or
obese was 6 to 7 times higher among students in private schools compared
to students in Government schools.
Table II


Differences in the Prevalence of Obesity/Overweight by Grade Level, Gender, and School Type (N=1818)
| |
IOTF reference* |
WHO reference# |
Indian reference‡ |
| |
Prevalance(95% CI) |
P value |
Prevalence (95%CI) |
P value |
Prevalence (95% CI) |
P value |
|
By grade |
|
8th grade |
8.37% |
(3.92-16.97) |
|
11.69% |
(3.04-35.84) |
|
11.84% |
(5.72-22.94) |
|
|
10th grade |
9.37% |
(4.41-18.83) |
0.395 |
11.59% |
(3.35-33.17) |
0.889 |
12.50% |
(6.03-24.12) |
0.642 |
|
By gender |
|
Boys |
9.37% |
(4.40 – 18.70) |
|
11.63% |
(5.50-22.90) |
|
13.86% |
(6.78-26.24) |
|
|
Girls |
8.05% |
(3.73 – 16.48) |
0.288 |
9.76% |
(4.52-19.80) |
0.181 |
9.80% |
(4.63-19.59) |
0.007 |
|
By school |
|
Private |
21.99% |
(16.77-28.30) |
|
26.62% |
(20.49-33.80) |
|
28.61% |
(22.19-36.02) |
|
|
Government |
3.13% |
(1.95-4.98) |
<0.001 |
3.89% |
(2.48-6.04) |
<0.001 |
4.48% |
(2.91-6.82) |
<0.001 |
|
Using mixed-effects regression models, school specified as a nested
random effect;*Using age- and gender-specific cut-points from the
International Obesity Task Force(9); #Using age- and
gender-specific cut-points from the World Health Organization(10);
‡Using age- and gender-specific cut-points from an Indian
growth reference study(7). |
Discussion
In studies of child and adolescent obesity, the
International Obesity Task Force reference is typically recommended for
use, especially for comparisons, worldwide [9]. In this study of
school-going youth from India, the IOTF reference consistently classified
participants in a lower weight status group, across all categories,
compared to the new WHO references and Indian references. That is,
compared to these references, the IOTF reference underestimated obesity.
The WHO and Indian references, in contrast, were very similar.
The "new" WHO reference was recently adopted at a
national workshop in India as the growth reference of choice for infants
and pre-school aged youth [17]. It may also be a good choice for
school-going youth in this setting, as well. Like the IOTF reference, the
"new" WHO reference uses an international sampling frame to construct its
cut-points, which allows for cross-national comparisons. Its sampling
frame, however, includes data from India, while the IOTF reference does
not [11,7]. At age 18 (IOTF) and 19 (WHO), both references align with the
recommended cut-offs for overweight ( ³
25 kg/m2) and obesity (
³
30 kg/m2) for adults in the West. In Asia, however, lower
cut-points for overweight (³
23 kg/m2) and obesity (³
25 kg/m2) are recommended for adults, since related co-morbid
conditions occur at lower BMI values [6]. Thus, the "new" WHO reference
may still underestimate the true extent of obesity in school-going youth
in India, but it performed better than the other international reference
used here.
Regardless of the growth reference used, it is clear
that obesity is problematic among adolescents in large cities of India,
like Delhi. In this study, the distribution of BMI was skewed, with a
longer tail at higher BMI values, which is characteristic of this epidemic
in other regions of the world [18]. Consistent with similar studies from
other cities in India, the prevalence of obesity was somewhat higher among
boys, as compared to girls [2-4]. In contrast to what is typically
observed in the West, obesity is most problematic among more affluent
youth in India, versus the less affluent. About 1 in every 4 (>25%)
students enrolled in Private schools in this study, which are more
affluent than Government schools, was overweight or obese. This estimate
is greater than that reported in comparable studies of affluent,
school-aged youth in other parts of India, like Hyderabad (<7%) [2] and
Ludhiana, (<15%) [3], but consistent with study from Delhi (>25%) [19].
Epidemiologic studies of adults seem to suggest obesity is most
problematic in north India, in cities like Delhi [20]. This may also be
true for adolescents.
Schools were not randomly chosen to participate in the
study, but were selected to be representative of the mix of types of
schools in Delhi. The study, therefore, provides a sample of school-aged
youth of different affluence, as well as both boys and girls from
different grade levels [13].
Future research should be cognizant of the different
growth references that can be used to define obesity among school-aged
youth in India, including their strengths and weaknesses. An accurate
understanding of which school-aged youth are affected by this emerging
epidemic is critical to subsequent studies designed to understand the
reasons for the same. These studies, in turn, must then be used to drive
the development of effective intervention, which is urgently required in
India.
Contributors: MHS is the Principal Investigator.
She was involved in study design, implementation, development of data
collection protocols and the conceptualization of the data analysis. MA
was involved as Project Director of the study in India, and worked on all
aspects of the design and implementation of the study, including
development of data collection protocols. PD and VT assisted with all data
analyses. RS oversaw data collection. KSR and CLP are Co-Investigators on
the study and assisted with its design and the development of data
collection protocols. MHS wrote the manuscript, with significant input
from all other co-authors listed. The final manuscript was approved by all
the authors.
Funding: University of Minnesota’s Obesity
Prevention Center (Stigler, PI) and the University of Texas School of
Public Health (Stigler, PI).
Competing interests: None stated.
|
What is Already Known?
• Many growth references can be used to define
childhood obesity in epidemiologic studies of school-going youth
(ages 5-18 years) in India, but the best choice is unclear.
What This Study Adds?
• The new WHO growth reference, which was
released in 2007, may be the best choice for measuring childhood
obesity among school-going youth in India, as it does not appear to
underestimate weight status and allows for comparisons with global
trends.
|
References
1. Prentice AM. The emerging epidemic of obesity in
developing countries. Intl J Epi. 2006;35:93-9.
2. Laxmaiah A, Nagalla B, Vijayaraghavan K, Nair M.
Factors affecting prevalence of overweight among 12- to 17-year-old urban
adolescents in Hyderabad, India. Obesity. 2007; 15:1384-90.
3. Aggarwal T, Bhatia RC, Singh D, Sorti PC. Prevalence
of obesity and overweight in affluent adolescents from Ludhiana, Punjab.
Indian Pediatr. 2008; 45: 500-2.
4. Raj M, Sundaram KR, Paul M, Deepa AS, Kumar RK.
Obesity in Indian children: Time trends and relationship with
hypertension. Nat Med J India. 2007;20:288-3.
5. UK Prospective Diabetes Study Group. UK Prospective
Diabetes Study XII: Differences between Asian, Afro-Caribbean, and white
Caucasian type 2 diabetic patients at diagnosis of diabetes. Diab Med.
1994;11:670-7.
6. Misra A. Revisions of cutoffs of body mass index to
define overweight and obesity are needed for the Asian-ethnic groups. Intl
J Obesity. 2003;27:1294-6.
7. Agarwal KN, Saxena A, Bansal AK, Agarwal DK.
Physical growth assessment in adolescence. Indian Pediatr. 2001;38:
1217-35.
8. Physical status: the use and interpretation of
anthropometry. Report of a WHO Expert Committee. World Health Organ Tech
Rep Ser. 1995;854:161-262.
9. Cole TJ, Bellizzi MC, Flegal KM, Dietz WH.
Establishing a standard definition for child overweight and obesity
worldwide: International survey. BMJ. 2000;320:1-6.
10. De Onis M, Onyango AW, Borghi E, Siyam A, Nishida
C, Siekmann J. Development of a WHO growth reference for school-aged
children and adolescents. Bull World Health Organ. 2007;85:660-7.
11. WHO Multicentre Growth Reference Study Group. WHO
Child Growth Standards based on length/height, weight, and age. Acta
Paediatr Suppl.2006;450:76-85.
12. De Onis M. The use of anthropometry in the
prevention of childhood overweight and obesity. Int J Obes Relat Metab
Disord. 2004;28:S81-5.
13. Lohman T, Roche A, Martorell R. Anthropometric
Standardization Reference Manual. Champaign, IL: Human Kinetics Books;
1988.
14. Cohen J. A coefficient of agreement for nominal
scale. Educat Psychol Measure.1960;20:37-46.
15. Cohen J. Weighted kappa: nominal scale agreement
with provision for scaled disagreement or partial credit. Psychol
Bull.1968;70:213-20.
16. Raudenbush SW, Bryk AS. Hierarchical linear models:
Applications and data analysis methods (2nd Ed). Thousand Oaks, CA: Sage
Publications; 2002.
17. WHO Country Office, India. National Workshop on
Adoption of New WHO Child Growth Standards, 8-9 February 2007, India
Habitat Center, New Delhi. Available from www.whoindia.org/en/Section6/Section426_1375.
htm. Accessed on May 12, 2009.
18. Kiess W, Marcus C, Wabitsch M. Obesity in Childhood
and Adolescence. Basel, Switzerland: Karger; 2004.
19. Sharma A, Sharma K, Mathur KP. Growth pattern and
prevalence of obesity in affluent schoolchildren in Delhi. Public Health
Nutrition. 2007;10:485-91.
20. Agrawal PK. Emerging obesity in northern Indian
states: A serious threat for health. Paper presented at the IUSSP
Conference in Bangkok, June. 10-2,2002.
|
|
|
 |
|
