|
|
|
Indian Pediatr 2015;52:
675-680 |
 |
Reference Centile Curves for Triceps
Skinfold Thickness for Indian Children aged 5–17 years and
Cut-offs for Predicting Risk of Childhood Hypertension: A
Multi-Centric Study
|
|
Anuradha Khadilkar, Rubina Mandlik, Shashi Chiplonkar,
Vaman Khadilkar,
Veena Ekbote and Vivek Patwardhan
From Jehangir Hospital and Hirabai Cowasji Jehangir
Medical Research Institute, Jehangir Hospital, Pune,
Maharashtra, India.
Correspondence to: Dr Anuradha Khadilkar, Department
of Pediatrics, Hirabai Cowasji Jehangir Medical Research Institute,
Jehangir Hospital, 32 Sassoon Road, Pune 411 001, India.
Email:
[email protected]
Received: October 28, 2014;
Initial review: December 05, 2014;
Accepted: May 30, 2015.
|
Objective: To create age- and gender-specific Triceps Skinfold
Thickness percentile curves for Indian children; and to determine
cut-offs for predicting the risk of childhood hypertension.
Design: Cross-sectional.
Setting: Multicentric,
school-based, 5 major Indian cities
Participants: 13375 children
(7590 boys) aged 5-17 years
Procedure: Data on height,
weight, blood pressure, triceps skinfold thickness (using Harpenden
Skinfold caliper) were collected. Reference triceps skinfold thickness
percentile curves were derived for boys and girls by LMS
(lambda-mu-sigma) method. Receiver operating curve analyses were
performed to determine the optimal cut-off of triceps skinfold thickness
centile for predicting the risk of hypertension.
Results: Percentile curves for
boys plateau around 13 years whereas for girls the curves increase
steadily till the age of 17 years. Median triceps skinfold thickness
increased by 7% to 9% till the age of 9 years in boys and girls. After
12 years, median triceps skinfold thickness decreased by 1% to 2% in
boys but increased by 3% to 4% in girls. The optimal cut-off percentile
yielding maximal sensitivity (68%) and specificity (74-78%) for
predicting high blood pressure was the 70th triceps skinfold thickness
percentile in both genders.
Conclusions: Percentile curves
for triceps skinfold thickness developed in the present study would be
useful in the assessment of adiposity and the risk of hypertension in
Indian children.
Keywords: Anthropometry, Adiposity, Blood
pressure, Body mass index.
|
|
Skinfold thickness is an important index for
assessment of body fat composition in children [1]. Although high body
mass index (BMI) in children may be an indicator of raised total body
fat, it may be inaccurate [2]. Reports suggest that skinfold thickness
is associated with adiposity even in non-obese children [3], leading to
the assumption that it may be a better predictor of cardiovascular risk
[2]. Thus, BMI followed by this measurement may help to correctly
identify excess body fat in children [4].
Triceps skinfold thickness (TSFT) measurements are
non-invasive and can function independently as predictors of childhood
hypertension [5]. We have previously reported (on the same dataset) a
positive association of TSFT with BP [6]. Furthermore, TSFT being easier
to obtain as compared to skinfold measurements at other sites (removal
of clothes not being a measurement requisite), making this technique
useful in epidemiological settings. Reference centiles for TSFT for
other populations [7,8] may not be applicable to Indian children due to
racial differences.
The primary objective of this study was to develop
reference centiles for TSFT representative of apparently healthy Indian
children and adolescents aged 5-17 years. A secondary objective was to
determine TSFT centile cut-offs to predict the risk of childhood
hypertension.
Methods
This study was part of a multi-centric study with the
objective of defining gender- and age-wise waist percentiles for Indian
children [9]. The study was performed in schools catering to children of
higher socio-economic status in 5 major Indian cities (Delhi, Chennai,
Pune, Kolkata and Raipur), one from each of the five zones [10] in
India. Data were collected from July 2011 to January 2012. Detailed
methodology has been previously detailed [6,9]. The study was approved
by the Ethics Committee of the Hirabai Cowasji Jehangir Medical Research
Institute.
Data were collected by the same team at each site;
equipments were calibrated daily. The mean inter-observer and
intra-observer coefficients of variation were <1% for TSFT, height and
BP measurements. BMI categories were defined as normal weight,
overweight and obese as per adult equivalent values for Asians [11] and
height-for-age (HAZ), weight-for-age (WAZ) and BMI-for-age (BAZ)
z-scores were computed as deviations from the median [12]. TSFT was
recorded using the Harpenden caliper, on the non-dominant upper arm
[13]. Average of two readings for all parameters was used for analysis.
Clinical assessments were carried out by
pediatricians to confirm good health. BP was recorded as previously
detailed [6]. SBP and/or DBP >90th percentile and < 95th percentile was
considered as prehypertension. SBP and/or DBP >95th percentile
was classified as hypertension [14].
Statistical Methods: All the statistical analyses
were performed using SPSS software (version 16.0.2007, SPSS Inc.,
Chicago, IL). Pearson’s correlation coefficient was computed gender-wise
between TSFT, age, height, weight and BMI. All results were expressed as
mean (SD) for comparability with other studies. Smoothed gender-specific
reference plots showing 5th, 10th, 25th, 50th, 75th, 85th and 95th
percentiles were derived using LMS method (LMSchartmaker Pro version
2.4, 2008; by Dr. Huiqi Pan and Dr. Tim Cole), which constructs
reference percentiles adjusted for skewness [15]. Each variable of
interest was summarized by three smooth curves plotted against age,
representing the median (M), coefficient of variation (S) and skewness
(L) of the measurement distribution [16]. Models were checked for
goodness of fit using the detrended Q-Q plot, Q Tests and worm plots
[17]. The LMS method was found to be appropriate to use for this data as
the measure of skewness of the data was 1.1 with a standard error of
0.03.
With the help of the LMS chartmaker, we also
determined the age- and gender-specific smoothed median triceps skinfold
thickness for children who were overweight and obese according to the
adult equivalent BMI cut-offs for Asians [8,11,18]. Receiver-operating
characteristic (ROC) analysis was performed for identifying gender-wise
risk of hypertension.
Results
A total of 13388 children (7596 boys) from the
selected schools were enrolled in the study.We excluded 13 outliers (5
children for height, 4 for BMI, and 4 for triceps). Anthropometric and
blood pressure data on 13375 children (7590 boys) aged 5-17 years were
analyzed for generating TSFT centiles. Table I describes
the anthropometric characteristics of the included children. All the
children were within reference range for anthropometric parameters, with
the means of HAZ, WAZ and BAZ around 0. Using adult equivalent cut-offs
for BMI [11, 13], 26% of children were found to be overweight and 14%
were obese. 89.5% of the children had normal SBP and 85.9% had normal
DBP.
TABLE 1 Baseline Characteristics of the Participants
|
Age (y) |
No. |
Weight (kg) |
Height (cm) |
BMI (kg/m2) |
TSFT (mm) |
SBP (mmHg) |
DBP (mmHg) |
|
Boys |
|
5 + |
417 |
19.5 (4.2) |
112.4 (7.2) |
15.3 (2.4) |
8.3 (3.1) |
88.2 (10.4) |
60.8 (8.1) |
|
6 + |
747 |
21.7 (4.7) |
117.8 (6) |
15.5 (2.6) |
8.9 (3.9) |
91.4 (10.6) |
62.4 (8.6) |
|
7 + |
638 |
25.2 (5.9) |
124.2 (6.5) |
16.3 (3) |
9.6 (4.2) |
96 (11.2) |
64.9 (8.6) |
|
8 + |
722 |
28.2 (7.3) |
129.3 (6.5) |
16.6 (3.3) |
10.4 (4.8) |
98.4 (11.4) |
67.6 (8) |
|
9 + |
708 |
31.5 (7.9) |
134.6 (6.6) |
17.3 (3.4) |
11.5 (5.3) |
101.6 (11.2) |
68.9 (8.3) |
|
10 + |
573 |
36.2 (8.9) |
140.4 (7.1) |
18.2 (3.6) |
13 (5.7) |
104.6 (10.6) |
69.5 (8.6) |
|
11 + |
733 |
40.1 (10) |
145.4 (8) |
18.9 (3.8) |
12.9 (6) |
106.7 (9.8) |
71.2 (8) |
|
12 + |
720 |
44.1 (11.6) |
151 (8.7) |
19.2 (4.1) |
13.3 (6.8) |
107.6 (10.8) |
72 (8.6) |
|
13 + |
741 |
48.9 (12.1) |
157.4 (8.7) |
19.6 (3.9) |
12.2 (6.4) |
109.2 (10.7) |
72.6 (8.5) |
|
14 + |
540 |
54.9 (12.7) |
164 (7.6) |
20.3 (4.1) |
12.4 (6.7) |
113 (11) |
73.3 (7.8) |
|
15 + |
509 |
59.3 (13.7) |
167.8 (7.2) |
21 (4.4) |
11.4 (6.3) |
115.4 (11.1) |
75.5 (7.4) |
|
16 + |
389 |
60.8 (12.6) |
169.4 (7) |
21.2 (4) |
11.4 (5.9) |
116.2 (10.4) |
76.2 (7) |
|
17 + |
153 |
64.8 (12.7 |
171.3 (6.5) |
22 (4.1) |
12.5 (6.4) |
118.4 (8.2) |
76.9 (7.8) |
|
Girls |
|
5 + |
391 |
19.3 (4) |
111.3 (6.0) |
15.5 (2.6) |
9.4 (3.6) |
89.8 (9.4) |
61.5 (8.5) |
|
6 + |
545 |
21.3 (4.8) |
116.9 (6.3) |
15.6 (2.7) |
9.8 (4) |
92.4 (10.7) |
63.1 (8.1) |
|
7 + |
491 |
24.4 (6.1) |
123 (6.3) |
16.1 (3.5) |
10.6 (3.9) |
95.3 (9.7) |
65.4 (8) |
|
8 + |
558 |
27.8 (6.9) |
128.8 (6.6) |
16.6 (3.1) |
12.1 (4.8) |
99.7 (11.2) |
67.2 (9) |
|
9 + |
540 |
30.4 (7.5) |
133.5 (7.1) |
17 (3.3) |
12.9 (5) |
100.7 (10.3) |
67.8 (8.2) |
|
10 + |
418 |
35.5 (8.3) |
140.4 (7.6) |
17.9 (3.3) |
13.8 (5.3) |
103 (11.1) |
68.9 (8.1) |
|
11 + |
523 |
40.5 (9.9) |
146.9 (8.2) |
18.7 (3.7) |
14.8 (6) |
106.9 (11) |
71.1 (8.3) |
|
12 + |
518 |
43.6 (9.8) |
151.5 (7.3) |
19 (3.8) |
14.3 (5.5) |
108.5 (11.2) |
71.7 (8.8) |
|
13 + |
560 |
48 (10.3) |
154.6 (6.4) |
20.1 (3.9) |
15.1 (6.1) |
110.1 (10.6) |
73.6 (8.1) |
|
14 + |
445 |
50.3 (10.2) |
155.9 (5.9) |
20.7 (3.9) |
15.7 (6.2) |
111.3 (10.7) |
73.5 (7.3) |
|
15 + |
389 |
52.8 (11.2) |
156.7 (6) |
21.5 (4.3) |
16.5 (5.9) |
111.1 (9.8) |
74.3 (6.9) |
|
16 + |
294 |
52.7 (10.1) |
157.4 (6.2) |
21.2 (3.6) |
16.6 (5.7) |
111.9 (12.7) |
74.8 (7.7) |
|
17 + |
113 |
53.9 (10.8) |
157.4 (6.1) |
21.7 (3.9) |
17.3 (6.5) |
113.6 (10) |
75.1 (7.3) |
*Results are expressed as mean (SD)
BMI: Body mass index; TSFT: Triceps skin-fold thickness; SBP:
Systolic blood pressure; DBP: Diastolic blood pressure. |
 |
|
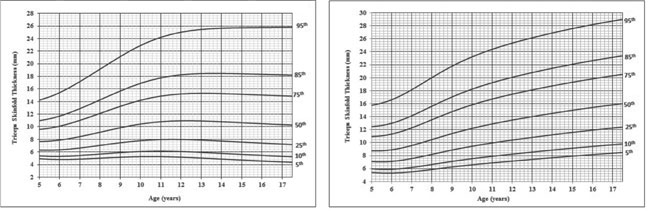
Fig. 1 Smoothed percentile curves for
triceps skinfold thickness in participants: (a) Boys, and (b)
Girls.
|
TSFT was significantly (P<0.01) associated
with age (r=0.18), weight (r=0.54), height (r=0.23) and BMI (r=0.77) in
boys as well as in girls [age (r=0.4); weight (r=0.72), height (r=0.44)
and BMI (r= 0.83)]. TSFT reference centile curves (5th, 10th, 25th,
50th, 75th, 85th and 95th) are presented for boys and girls in Fig.
1a and 1b, respectively. Corresponding smoothed
percentile values are given according to age and gender in Table
II and III. The model was considered a good fit as per the
shape of the worm plot; the Q statistic curves for L, M & S were within
-2 and +2, and the detrended Q-Q plot indicated that the population was
approximately normal. The smoothed percentile curves for boys plateaued
around the age of 13 years whereas for girls the smoothed curves
increased steadily till the age of 18 years (Fig. 1a
and 1b). Median TSFT increased by 7% to 9% till the age of
9 years in both genders. After the age of 12 years, median TSFT
decreased by 1% to 2% in boys but showed increase by 3% to 4% in girls.
Percentiles lower than 50th were more flat than the higher percentiles
in boys. On the other hand, increasing trend was seen at lower as well
as higher centiles in girls.
 |
|
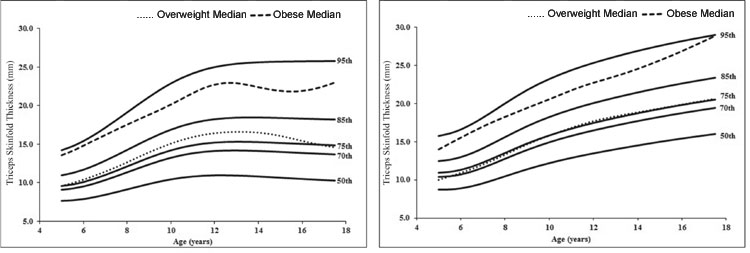
Fig. 2 Triceps skinfold thickness
percentiles with median TSFT percentile for overweight and obese
participants (a) boys and (b)girls.
|
To judge the efficacy of TSFT centiles in identifying
excess body fat and in turn risk of hypertension, ROC analysis was
carried out. The optimal cut-off percentile yielding maximal sensitivity
and specificity for predicting high BP was 70th TSFT percentile in boys
and girls, the values for which are presented in Table II
and III. Area under the curve (AUC) was 0.778 (95% CI: 0.753,
0.803) in boys with 68% sensitivity and 78% specificity. In girls, AUC
was 0.749 [95% CI (0.713, 0.785)] with 68% sensitivity and 74%
specificity.
TABLE II	Triceps Skinfold Thickness (tsft) Percentiles Values for Boys with Cut-off Value
of 70th percentile of TSFT for Hypertension Risk
|
Age |
5th |
10th |
25th |
50th |
70th |
75th |
85th |
95th |
|
5 |
4.9 |
5.4 |
6.3 |
7.7 |
9.1 |
9.6 |
11.0 |
14.2 |
|
5.5 |
4.8 |
5.3 |
6.3 |
7.7 |
9.2 |
9.8 |
11.3 |
14.7 |
|
6 |
4.8 |
5.3 |
6.3 |
7.9 |
9.5 |
10.1 |
11.7 |
15.4 |
|
6.5 |
4.8 |
5.3 |
6.5 |
8.1 |
9.9 |
10.5 |
12.2 |
16.2 |
|
7 |
4.9 |
5.4 |
6.6 |
8.4 |
10.3 |
11.0 |
12.9 |
17.1 |
|
7.5 |
4.9 |
5.5 |
6.8 |
8.8 |
10.8 |
11.6 |
13.6 |
18.1 |
|
8 |
5.0 |
5.7 |
7.0 |
9.1 |
11.4 |
12.1 |
14.3 |
19.1 |
|
8.5 |
5.1 |
5.8 |
7.3 |
9.5 |
11.9 |
12.7 |
15.0 |
20.2 |
|
9 |
5.2 |
5.9 |
7.5 |
9.8 |
12.4 |
13.2 |
15.7 |
21.1 |
|
9.5 |
5.2 |
6.0 |
7.6 |
10.2 |
12.8 |
13.8 |
16.3 |
22.1 |
|
10 |
5.3 |
6.1 |
7.8 |
10.4 |
13.2 |
14.2 |
16.9 |
22.9 |
|
10.5 |
5.3 |
6.1 |
7.9 |
10.6 |
13.6 |
14.6 |
17.4 |
23.6 |
|
11 |
5.3 |
6.1 |
8.0 |
10.8 |
13.8 |
14.9 |
17.8 |
24.2 |
|
11.5 |
5.2 |
6.1 |
8.0 |
10.9 |
14.0 |
15.1 |
18.0 |
24.7 |
|
12 |
5.2 |
6.1 |
8.0 |
10.9 |
14.1 |
15.2 |
18.2 |
25.0 |
|
12.5 |
5.1 |
6.0 |
7.9 |
11.0 |
14.2 |
15.3 |
18.4 |
25.3 |
|
13 |
5.0 |
5.9 |
7.9 |
10.9 |
14.2 |
15.3 |
18.4 |
25.4 |
|
13.5 |
5.0 |
5.9 |
7.8 |
10.9 |
14.2 |
15.3 |
18.5 |
25.6 |
|
14 |
4.9 |
5.8 |
7.7 |
10.8 |
14.1 |
15.3 |
18.5 |
25.6 |
|
14.5 |
4.8 |
5.7 |
7.6 |
10.7 |
14.1 |
15.2 |
18.4 |
25.7 |
|
15 |
4.7 |
5.6 |
7.6 |
10.6 |
14.0 |
15.2 |
18.4 |
25.7 |
|
15.5 |
4.6 |
5.5 |
7.5 |
10.6 |
13.9 |
15.1 |
18.4 |
25.7 |
|
16 |
4.6 |
5.5 |
7.4 |
10.5 |
13.9 |
15.0 |
18.3 |
25.8 |
|
16.5 |
4.5 |
5.4 |
7.3 |
10.4 |
13.8 |
15.0 |
18.3 |
25.8 |
|
17 |
4.4 |
5.3 |
7.2 |
10.3 |
13.7 |
14.9 |
18.2 |
25.8 |
|
17.5 |
4.4 |
5.2 |
7.2 |
10.3 |
13.7 |
14.9 |
18.2 |
25.8 |
TABLE III	Triceps Skinfold Thickness (tsft) Percentiles Values for Girls with
Cut-off Value of 70th percentile of TSFT for Hypertension Risk
|
Age |
5th |
10th |
25th |
50th |
70th |
75th |
85th |
95th |
|
5 |
5.4 |
6.0 |
7.1 |
8.7 |
10.4 |
10.9 |
12.5 |
15.8 |
|
5.5 |
5.3 |
5.9 |
7.0 |
8.7 |
10.5 |
11.1 |
12.6 |
16.1 |
|
6 |
5.3 |
5.9 |
7.1 |
8.9 |
10.7 |
11.3 |
13.0 |
16.6 |
|
6.5 |
5.4 |
6.0 |
7.3 |
9.2 |
11.1 |
11.7 |
13.5 |
17.3 |
|
7 |
5.5 |
6.2 |
7.5 |
9.6 |
11.6 |
12.3 |
14.1 |
18.2 |
|
7.5 |
5.7 |
6.4 |
7.9 |
10.0 |
12.2 |
12.9 |
14.9 |
19.1 |
|
8 |
5.9 |
6.6 |
8.2 |
10.5 |
12.8 |
13.5 |
15.6 |
20.0 |
|
8.5 |
6.1 |
6.9 |
8.5 |
10.9 |
13.4 |
14.2 |
16.3 |
20.9 |
|
9 |
6.2 |
7.1 |
8.9 |
11.4 |
13.9 |
14.8 |
17.0 |
21.8 |
|
9.5 |
6.4 |
7.3 |
9.2 |
11.8 |
14.5 |
15.3 |
17.7 |
22.5 |
|
10 |
6.6 |
7.5 |
9.4 |
12.2 |
14.9 |
15.8 |
18.2 |
23.2 |
|
10.5 |
6.7 |
7.7 |
9.7 |
12.6 |
15.4 |
16.3 |
18.8 |
23.8 |
|
11 |
6.9 |
7.9 |
9.9 |
12.9 |
15.8 |
16.7 |
19.2 |
24.4 |
|
11.5 |
7.0 |
8.1 |
10.2 |
13.2 |
16.1 |
17.1 |
19.7 |
24.9 |
|
12 |
7.2 |
8.2 |
10.4 |
13.5 |
16.5 |
17.5 |
20.1 |
25.3 |
|
12.5 |
7.3 |
8.4 |
10.6 |
13.8 |
16.8 |
17.8 |
20.4 |
25.8 |
|
13 |
7.4 |
8.5 |
10.8 |
14.0 |
17.1 |
18.1 |
20.8 |
26.2 |
|
13.5 |
7.5 |
8.7 |
11.0 |
14.3 |
17.4 |
18.4 |
21.1 |
26.5 |
|
14 |
7.7 |
8.8 |
11.2 |
14.5 |
17.7 |
18.7 |
21.5 |
26.9 |
|
14.5 |
7.8 |
9.0 |
11.4 |
14.8 |
18.0 |
19.0 |
21.8 |
27.3 |
|
15 |
7.9 |
9.1 |
11.6 |
15.0 |
18.3 |
19.3 |
22.1 |
27.6 |
|
15.5 |
8.0 |
9.3 |
11.8 |
15.2 |
18.5 |
19.6 |
22.4 |
27.9 |
|
16 |
8.2 |
9.4 |
11.9 |
15.4 |
18.8 |
19.8 |
22.6 |
28.2 |
|
16.5 |
8.3 |
9.5 |
12.1 |
15.6 |
19.0 |
20.1 |
22.9 |
28.5 |
|
17 |
8.4 |
9.7 |
12.3 |
15.8 |
19.2 |
20.3 |
23.1 |
28.7 |
|
17.5 |
8.5 |
9.8 |
12.4 |
16.0 |
19.4 |
20.5 |
23.4 |
29. |
Fig. 2a and 2b
illustrate the trajectory of the median TSFT curve for children
classified overweight and obese according to BMI criteria. For boys, the
median skinfold thickness for overweight boys was above the 75th
percentile for TSFT, and the median TSFT for obese boys was above the
85th percentile for TSFT across age. For girls, the median skinfold
thickness for overweight girls tracked the 75th percentile for skinfold
thickness neatly while the median for obese girls was above the 85th
percentile for skinfold thickness across age.
Discussion
The present study provides age- and gender-specific
reference percentiles of TSFT for Indian children and adolescents.
Reports suggest that the ability of TSFT percentiles to screen for
adiposity is similar to that of BMI or waist circumference [19]. Around
15% children in this study had TSFT values above the 75th percentile
even when their BMI was within normal range as judged by BMI adult
equivalent cut-offs. This suggests that at lower BMI Indian children may
have higher body fat percent [20].
In comparison with TSFT percentiles developed for
Polish children using Harpenden caliper [7], it was observed that Indian
children had similar TSFT values as compared to Polish children upto the
50th centile in boys and upto the 75th centile in girls, after which the
TSFT values were higher in Indian children. This may partly be due to
the tendency of Asians to have higher body fat than their Western
counterparts at lower or similar BMI [21, 22]. TSFT centiles above 50th
percentile in Indian boys in the present study were higher than the
reference centiles of TSFT in Caucasian boys using Lange calipers
whereas the TSFT centile values of girls were similar [8]. The
percentage difference between the 50th and 95th percentile for TSFT by
Harpenden caliper for Indian children (123.5% for boys, 86.8% for girls)
in the current study was compared with Caucasian children as measured by
Lange calipers (124.7% for boys, 89.5% for girls). The small magnitude
of differences in TSFT centiles may be due to the difference in
measurement technique.
The cut-off of 70th percentile of TSFT in our study
for predicting hypertension is similar to the cut-off for waist
circumference percentile suggested by us for screening for metabolic
syndrome risk for both genders [9]. While we have reported cut-offs for
TSFT for predicting risk for childhood hypertension in an earlier
publication [6], these cut-offs were based on Western data due to
absence of Indian reference data. The present cut-offs, based on Indian
reference data, are lower than those earlier reported and may be used
effectively to screen Indian children with a risk for hypertension.
One of the limitations of the study is the
comparability of Harpenden calipers with other instruments for measuring
TSFT. Therefore, similar methods of measuring TSFT need to be employed
for using these centiles. Another limitation is that TSFT is prone to
measurement errors by technicians and it is imperative that trained
personnel measure TSFT. Additionally, while our rates of false
positivity are comparable to those reported earlier [23], one of the
reasons for the low specificity may be that triceps skinfold thickness
is an indicator of presence of excess fat and is not a measure of total
body fat.
In summary, our study provides smoothed TSFT
percentiles for Indian children and adolescents using a multicentric
nationwide data. These percentiles would be useful in field studies for
screening adiposity and risk of hypertension.
Acknowledgements: Neha Kajale, Lavanya
Parthasarathy, Surabhi Kulkarni, Archana Arya, Anjan Bhattacharya,
Sanwar Agarwal, Deepa Pillay and Shamim Momin.
Contributors: AVK: conceptualized and designed
the study, coordinated and supervised data collection at the sites,
carried out the initial analyses, reviewed and revised the manuscript;
RM: data analyses and drafted the initial manuscript; SAC:
conceptualized and designed the study, carried out the analyses,
reviewed and revised the manuscript; VVK: conceptualized and designed
the study, critically reviewed the manuscript; VHE: conceptualized and
designed the study, coordinated and supervised data collection at the
sites; VGP: carried out data management and analyses. All authors
approved the final version of manuscript.
Funding: Novo Nordisk India Pvt. Ltd. Ms
Rubina Mandlik was funded by a Fellowship Grant from the
University Grants Commission (UGC), Government of India.
Competing interests: None stated.
|
What is Already Known?
•
Triceps skinfold thickness
(TSFT) measurements are useful in assessment of adiposity in
children and can function as stand-alone predictors of childhood
hypertension.
What This Study Adds?
•
Age-and gender-specific smoothed reference percentiles
curves of TSFT for Indian children and adolescents are provided.
•
A cut-off of 70th percentile of TSFT is suggested to predict
pediatric hypertension.
|
References
1. Reilly JJ, Wilson J, Durnin JV. Determination of
body composition from skinfold thickness: a validation study. Arch Dis
Child. 1995;73:305-10.
2. Freedman DS, Dietz WH, Srinivasan SR, Berenson GS.
Risk factors and adult body mass index among overweight children: the
Bogalusa Heart Study. Pediatrics. 2009;123:750-7.
3. Freedman DS, Wang J, Ogden CL, Thornton JC, Mei Z,
Pierson RN, et al. The prediction of body fatness by BMI and
skinfold thicknesses among children and adolescents. Ann Hum Biol.
2007;34:183-94.
4. Himes JH, Dietz WH. Guidelines for overweight in
adolescent preventive services: recommendations from an expert
committee. The Expert Committee on Clinical Guidelines for Overweight in
Adolescent Preventive Services. Am J Clin Nutr. 1994;59:307-16.
5. Moser DC, Giuliano Ide C, Titski AC, Gaya AR,
Coelho-e-Silva MJ, Leite N. Anthropometric measures and blood pressure
in school children. J Pediatr (Rio J). 2013;89:243-9.
6. Kajale NA, Khadilkar AV, Chiplonkar SA, Khadilkar
VV. Body fat indices for identifying risk of hypertension in Indian
children. Indian Pediatr. 2014;51:555-60.
7. Jaworski M, Ku³aga Z, P³udowski P, Grajda A,
Gurzkowska B, Napieralska E, et al.; OLAF Study Group.
Population-based centile curves for triceps, subscapular, and abdominal
skinfold thicknesses in Polish children and adolescents – the OLAF
study. Eur J Pediatr. 2012;171:1215-21.
8. Addo OY, Himes JH. Reference curves for triceps
and subscapular skinfold thicknesses in US children and adolescents. Am
J Clin Nutr. 2010;91:635-42.
9. Khadilkar A, Ekbote V, Chiplonkar S, Khadilkar V,
Kajale N, Kulkarni S, et al. Waist circumference percentiles in
2-18 year old Indian children. J Pediatr. 2014;164:1358-62.
10. Indian Academy of Pediatrics Growth Charts
Committee, Khadilkar V, Yadav S, Agrawal KK, Tamboli S, Banerjee M,
Cherian A, et al. Revised IAP growth charts for height, weight
and body mass index for 5- to 18-year-old Indian Children. Indian
Pediatr.2015.52:47-55.
11. Khadilkar VV, Khadilkar AV, Borade AB, Chiplonkar
SA. Body mass index cut-offs for screening for childhood overweight and
obesity in Indian children. Indian Pediatr. 2012;49:29-34.
12. Khadilkar VV, Khadilkar AV, Cole TJ, Sayyad MG.
Cross-sectional growth curves for height, weight and body mass index for
affluent Indian children, 2007. Indian Pediatr. 2009;46:477-89.
13. National Health and Nutrition Examination Survey.
Anthropometry Procedures Manual (revised January 2004); 35. Available
from: http://www.cdc.gov/nchs/data/nhanes/nhanes_03_04/BM.pdf.
Accessed October 28, 2014.
14. National High Blood Pressure Education Program
Working Group on High Blood Pressure in Children and Adolescents. The
fourth report on the diagnosis, evaluation, and treatment of high blood
pressure in children and adolescents. Pediatrics. 2004;114:555-76.
15. van ‘t Hof MA, Wit JM, Roede MJ. A method to
construct age references for skewed skinfold data, using Box-Cox
transformations to normality. Hum Biol. 1985;57:131-9.
16. Cole TJ, Green PJ. Smoothing reference centile
curves: the LMS method and penalized likelihood. Stat Med.
1992;11:1305-19.
17. van Buuren S, Fredriks M. Worm plot: a simple
diagnostic device for modelling growth reference curves. Stat Med.
2001;20:1259-77.
18. Cole TJ, Bellizzi MC, Flegal KM, Dietz WH.
Establishing a standard definition for child overweight and obesity
worldwide: international survey. BMJ. 2000;320:1240-3.
19. Krebs NF, Himes JH, Jacobson D, Nicklas TA,
Guilday P, Styne D. Assessment of child and adolescent overweight and
obesity. Pediatrics. 2007;120:S193-228.
20. Pandit D, Chiplonkar S, Khadilkar A, Khadilkar V,
Ekbote V. Body fat percentages by dual-energy X-ray
absorptiometry corresponding to body mass index cutoffs for overweight
and obesity in Indian Children. Clin Med Pediatr. 2009;3:55-61.
21. WHO Expert Consultation. Appropriate body-mass
index for Asian populations and its implications for policy and
intervention strategies. Lancet. 2004;363:157-63.
22. Yajnik CS, Yudkin JS. The Y-Y paradox. Lancet.
2004;363:163.
23. Sardinha LB, Going SB, Teixeira PJ, Lohman TG.
Receiver operating characteristic analysis of body mass index, triceps
skinfold thickness and arm girth for obesity screening in children and
adolescents. Am J Clin Nutr. 1999;70:1090- 5.
|
|
|
 |
|
