 |
|
Original Articles Indian Pediatrics 2002; 39:331-338 |
||||||||||||||||||||||||||||||||||||||||||||||||||||||||||||||||||||||||||||||||||||||||||||||||||||||||||||||||||||||||||||||||||||||||||||||||||||||||||||||||||||||||||||||||||||||||||||||||||||||||||||||||||||||||||||||||||||||||||||||||||||||||||||||||||||||||||||||||||||||||||||||||||||||||||||||||||||||||||||||||||||||||||||||||||||||||||||||||||||||||||||||||||||||||||||||||||||||||||||||||||||||||||||||||||||||||||||||||||||||||||||||||||||||||||||||||||||
|
Diet and Nutritional Status of Rural Preschool Children in Punjab |
||||||||||||||||||||||||||||||||||||||||||||||||||||||||||||||||||||||||||||||||||||||||||||||||||||||||||||||||||||||||||||||||||||||||||||||||||||||||||||||||||||||||||||||||||||||||||||||||||||||||||||||||||||||||||||||||||||||||||||||||||||||||||||||||||||||||||||||||||||||||||||||||||||||||||||||||||||||||||||||||||||||||||||||||||||||||||||||||||||||||||||||||||||||||||||||||||||||||||||||||||||||||||||||||||||||||||||||||||||||||||||||||||||||||||||||||||||
|
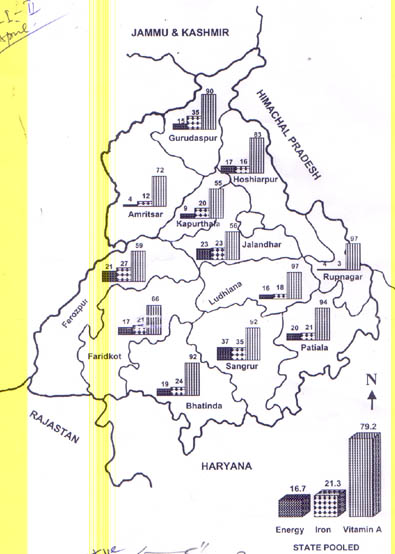
UNDERNUTRITION continues to be a public health problem in India, particularly among vulnerable groups such as preschool children, pregnant and lactating women, despite dramatic increase in food production at national level. The National Nutrition Policy(1) and the National Plan of Action on Nutrition(2), formulated by Government of India, enunciated strategies to control undernutrition. Information on nutritional status of population at district level is required to initiate appropriate nutrition intervention strategies. Such data is not available for Punjab. Hence, the present study was carried out, at the request of the Department of Women and Child Development, Government of India to assess diet and nutrition status of preschool children in the rural areas of Punjab. Subjects and Methods Socio-economic Background of the State Punjab, located in North Western part of India, primarily is an agrarian state. About 70% people are engaged in agriculture, as against the national figure of 51%. The per capita availability of food grains (923 kg/caput/year) is five folds higher than the national average of 174 kg(3). The annual per capita income (Rs. 8,281) was also higher than the national per capita annual income (Rs. 4,974 at 1990-91 prices). These socio-economic indicators indicate that the state was better than many other states including the neighboring northern states and Union Territories, viz. Haryana, Himachal Pradesh, Rajasthan, Uttar Pradesh, Delhi and Chandigarh. The survey was carried out in all the 12 districts of the state. In each district, 400 households (HHs) from twenty villages, were selected, giving due representation to all the blocks/taluks by adopting systematic random sampling procedure according to probability proportion to size(4). In each village, 20 HHs were selected from 5 clusters, which are natural formations in a village such as streets/mohallas/areas. At least one cluster was selected from scheduled caste and/or scheduled tribe area and the remaining four clusters were selected from other areas. In each cluster, four contiguous households were surveyed by selecting a random start. Subjects Demographic and socio-economic particulars were collected from all the selected HHs. Diet survey was carried out in every alternate HH, by using 24-hours recall method(5). Standing height (anthropometer rod) and body weight (Chatillon weighing scale) were taken on all the available individuals in the selected households, by adopting standard procedures(6). Crown-heel length was measured by using an infantometer in the case of children less than the age of 2 years. All the individuals were examined clinically for the presence of nutritional deficiency signs. All the investigators were trained and standardized in the methodology of diet surveys and nutritional anthropometry to keep inter and intra-individual variations in acceptable limits. The anthropometric data was compared with international reference median values(7). Senior faculty from the National Institute of Nutrition carried out random checks in 5% of the sample. Constraints of the Study Keeping in view available resources like money, manpower and time available, the minimum required sample was covered from each district. Only diet and nutritional status of preschool children, at state level, is being described in the present manuscript. The survey was time bound and carried out from July 1994 to January 1995. Therefore, the seasonal variations couldn’t be considered. Analysis Food and Nutrient Intake of Individuals The average daily intake of various foods was computed for sex and age groups of preschool children. The nutrient intakes were calculated using food composition tables(8). The food and nutrient intakes were compared with the balanced diets recommended by the ICMR(9) and the nutrient intakes were compared with the recommended Nutrients Requirements for Indians(10). Anthropometry The age of the children <5 years was assessed up to nearest month from birth records wherever available or by using local events calendar, wherever necessary. The extent of underweight (low weight for age), stunting (low height for age) and wasting (low weight for height) was also determined by Standard Deviation Classfication(11). All the children with values less than Median-2SD of NCHS for the respective measurement were considered as underweight/stunted/wasted, respectively. Those with below the Median-3SD were considered as severely under-nourished for the respective measurement. The results at the state level were compared with those for Northern region of the country as well as National figures(12) and results of NFHS Surveys(13,14). Results Coverage A total of 4761 HHs from 240 villages were covered. Data on food and nutrient intake was also collected from 2369 HHs. About 2,261 preschool children (1-5 years of age) were covered for anthropometry and clinical examination. Demographic and Socio-economic Profile The average family size was 5.7. About 40% of the HHs belonged to scheduled caste and 14% to backward communities. Rest of them belonged to other communities (45.6%) and scheduled tribes (0.8%). The proportion of scheduled caste population was the highest in the district of Jalandhar (47.5%) and the lowest in Ferozepur (21.8%). About sixty per cent of heads of the households and 37 per cent of their spouses in the surveyed area were literate. Twenty per cent of families lived in pucca houses, 53% in semi-pucca and 27% in kutcha houses. About 41% of HHs had agricultural lands; 9% were marginal farmers (<2.5 acres), 10% small farmers (2.5-5.0 acres) and 22% large farmers ( >5.0 acres). A large proportion of the heads of the HH were involved in agriculture (34.6%) and allied activities (12.5%), while about 27% were laborers. Food and Nutrient Intakes of 1-6 years Children The intake of all the foods, except roots and tubers and sugar and jaggery was below the recommended levels among 1-3 and 4-6 years. The preschool children had adequate intake of protein, calcium and thiamine comparable to RDI. In the case of other nutrients, the deficit was higher in the case of vitamin A (57.7%), followed by iron (32.5%), riboflavin (28.5%) and energy (29.1%) among 1-3 years children, while in case of 4-6 years children, the deficit ranged from 2.7% for niacin to 39.2% for vitamin C. District-wise Proportion of Households with Low Levels (<70% RDI) of Nutrient Intakes An attempt was made to study, if there was any particular clustering of districts with respect to deficient nutrient intakes in different districts (Fig. 1). About 80-90% of the household consumed vitamin A less than 70% of RDI in 7 districts; while 35% of the households were consuming iron (<70% RDI) in 2 districts namely Sangrur and Gurudaspur. Similarly, more than 20% of households were consuming inadequate energy (<70% RDI) in the districts of Sangrur, Patiala, Ferozpur and Jalandhar. Nutritional Status The severe forms of clinical signs of protein energy malnutrition (PEM), such as marasmus and kwashiorkor among less than 5 years children were absent while the prevalence of Bitot spots was 0.1%.
Fig. 1 . Distribution (%) of HHs consuming energy, iron and vitamin A, below <70% RDI. The proportion of pre-school children having weights below median-2SD of NCHS Standards was 50.3% as against 48% for Northern region and was comparable to the National average (50%) (Table 1). The prevalence of severe undernutrition (<median – 3SD) in the state (19%) was comparable to national average (20.9%) and marginally higher than the northern region (16.1%). About 60% children were stunted, while about 38% were severely stunted. There was considerable variation in the prevalence of stunting and the highest prevalence of severe stunting was observed in the district of Rupnagar (55%) followed by Ferozpur (47%), Jalandhar (43%) and Faridkot (40%). The overall magnitude of wasting was about 12%. Table II summarizes the nutritional profile according to socio-economic variables.
Table I__Distribution (%) of Preschool Children by Nutritional Status: Standard Deviation Classification
Table II__Nutritional Profile of Rural Population According to Socio-economic Variables
Discussion Although Punjab is better than the other states of India with respect to per capita income and food production, there were large variations in the levels of consumption of micronutrient rich foods like green leafy vegetables, other vegetables and fats and oils. Micronutrient deficiencies such as vitamin C (62.5%) and vitamin A (51.7%) were higher among 1-3 year age group children as compared to 4-6 years (30% and 21.5%, respectively). About 50% of preschool children were undernourished, a figure comparable to that reported by NFHS-1(13). The proportion of children with stunting was also high (60%) compared to NFHS-1 observations (40%), while the extent of wasting was about 12%, which was significantly lower as compared to the findings of present survey. However, it is to be noted that the age groups covered in the NFHS-1 and II were 0-4 and 0-3 years, respectively. In the present survey the age group reported was 1-5 years children. So, naturally there could be a difference in the prevalence of undernutrition between the surveys. The factors responsible for the high prevalence of undernutrition in the districts of Rupnagar and Ludhiana, could be the higher proportion of HHs living in kutcha houses, with the per capita income less than Rs. 5000/- annum and a higher proportion of HHs were involved in the occupation of labor and allied activities (Table II). Multivariate analysis of the data has indicated that the poor housing, small size of landholding, backward communities, occupation such as labor and low literacy status of head of the households, adversely influenced the nutritional status. There is a need to explore the role of other factors (other than diet) influencing nutritional status of children such as availability of health care facilities, protected water supply, personal hygiene and environmental sanitation, etc., which are important determinants of nutritional status. It may also be realized that absence of one to one relationship between dietary intakes and undernutrition could be due to the fact, that while nutritional status is a result of cumulative influence of diet over a time along with other factors, the dietary measurement involved only assessment of one day’s intakes. Efforts, therefore, should be directed towards activities to improve household income, better housing conditions, overall literacy and access to health care facilities, to help in the reduction of undernutrition and improve the overall nutritional status of rural population. Acknowledgements The authors gratefully acknowledge the generous financial assistance provided by the Food and Nutrition Board, Department of Women and Child Development, Government of India to carry out the study. The authors also thank the staff of CFNEU, Department of Food and Nutrition Board, Chandigarh for their help and co-operation throughout the study. Out thanks are due to all the investigators involved in collection of data and technical staff involved in the data scrutiny and processing. The authors are extremely grateful to the community for their unstinted co-operation. Contributors: KV, DHR and GNVB were involved in the planning, design, training of the investigators and critical review of the manuscript; AL was involved in design, training of the investigators, supervision of data collection and checking of data for quality and consistency and drafting of the manuscript and will also act as guarantor for the paper; KMR was involved in the training of the investigators, checking of the data for quality and consistency and assisted in the drafting of the manuscript; SK and MRN were involved in the training of the investigators, supervision of data collection and checking for quality and consistency. KK and GR were involved in data processing and analysis. Funding: Department of Women and Child Develop-ment, Ministry of Human Resource Development, Government of India. Competing interests: None declared.
| ||||||||||||||||||||||||||||||||||||||||||||||||||||||||||||||||||||||||||||||||||||||||||||||||||||||||||||||||||||||||||||||||||||||||||||||||||||||||||||||||||||||||||||||||||||||||||||||||||||||||||||||||||||||||||||||||||||||||||||||||||||||||||||||||||||||||||||||||||||||||||||||||||||||||||||||||||||||||||||||||||||||||||||||||||||||||||||||||||||||||||||||||||||||||||||||||||||||||||||||||||||||||||||||||||||||||||||||||||||||||||||||||||||||||||||||||||||
| References | ||||||||||||||||||||||||||||||||||||||||||||||||||||||||||||||||||||||||||||||||||||||||||||||||||||||||||||||||||||||||||||||||||||||||||||||||||||||||||||||||||||||||||||||||||||||||||||||||||||||||||||||||||||||||||||||||||||||||||||||||||||||||||||||||||||||||||||||||||||||||||||||||||||||||||||||||||||||||||||||||||||||||||||||||||||||||||||||||||||||||||||||||||||||||||||||||||||||||||||||||||||||||||||||||||||||||||||||||||||||||||||||||||||||||||||||||||||
| ||||||||||||||||||||||||||||||||||||||||||||||||||||||||||||||||||||||||||||||||||||||||||||||||||||||||||||||||||||||||||||||||||||||||||||||||||||||||||||||||||||||||||||||||||||||||||||||||||||||||||||||||||||||||||||||||||||||||||||||||||||||||||||||||||||||||||||||||||||||||||||||||||||||||||||||||||||||||||||||||||||||||||||||||||||||||||||||||||||||||||||||||||||||||||||||||||||||||||||||||||||||||||||||||||||||||||||||||||||||||||||||||||||||||||||||||||||
![]()